The question in this compilation is whether a large on-chain stablecoin transfer total identifies where commercial payments settle. TechFlow published its write-up on 11 November 2026 at 09:55 UTC+8, compiling joint research by Glassnode and NOWPayments. The windows inside the summary end earlier: chain shares cover September 2025 through September 2026, the hourly view covers 39 complete weeks before 4 October 2026, and the supply and daily-flow figures are as of 5 October 2026. Those dates are the observation windows, not a later update.
What each number counts
Two datasets are paired, and they do not record the same event.
The on-chain side is transfer value for USDT and USDC on public ledgers, expressed in dollars. A transfer is a recorded movement of the token. The metric is not a field that marks a sale, and TechFlow’s summary says an ordinary blockchain transfer record cannot be treated as a commercial payment.
The merchant side is the NOWPayments checkout: amounts, and separately counts, of stablecoin receipts for that gateway’s merchants. It is one processor’s book. It is not a chain-wide census of commerce, and it does not identify who controls an address.
An active address is an address with activity in the window, not a person. USDT and USDC are described as dollar-pegged and as the bulk of the stablecoin market, but the summary says their use still differs by chain, payment setting and participant group. For a business choosing what to accept, that choice is tied to whether a customer can pay, what fee is incurred, and how complex reconciliation is, because the receipt lands on a different ledger.
Value share is not receipt share
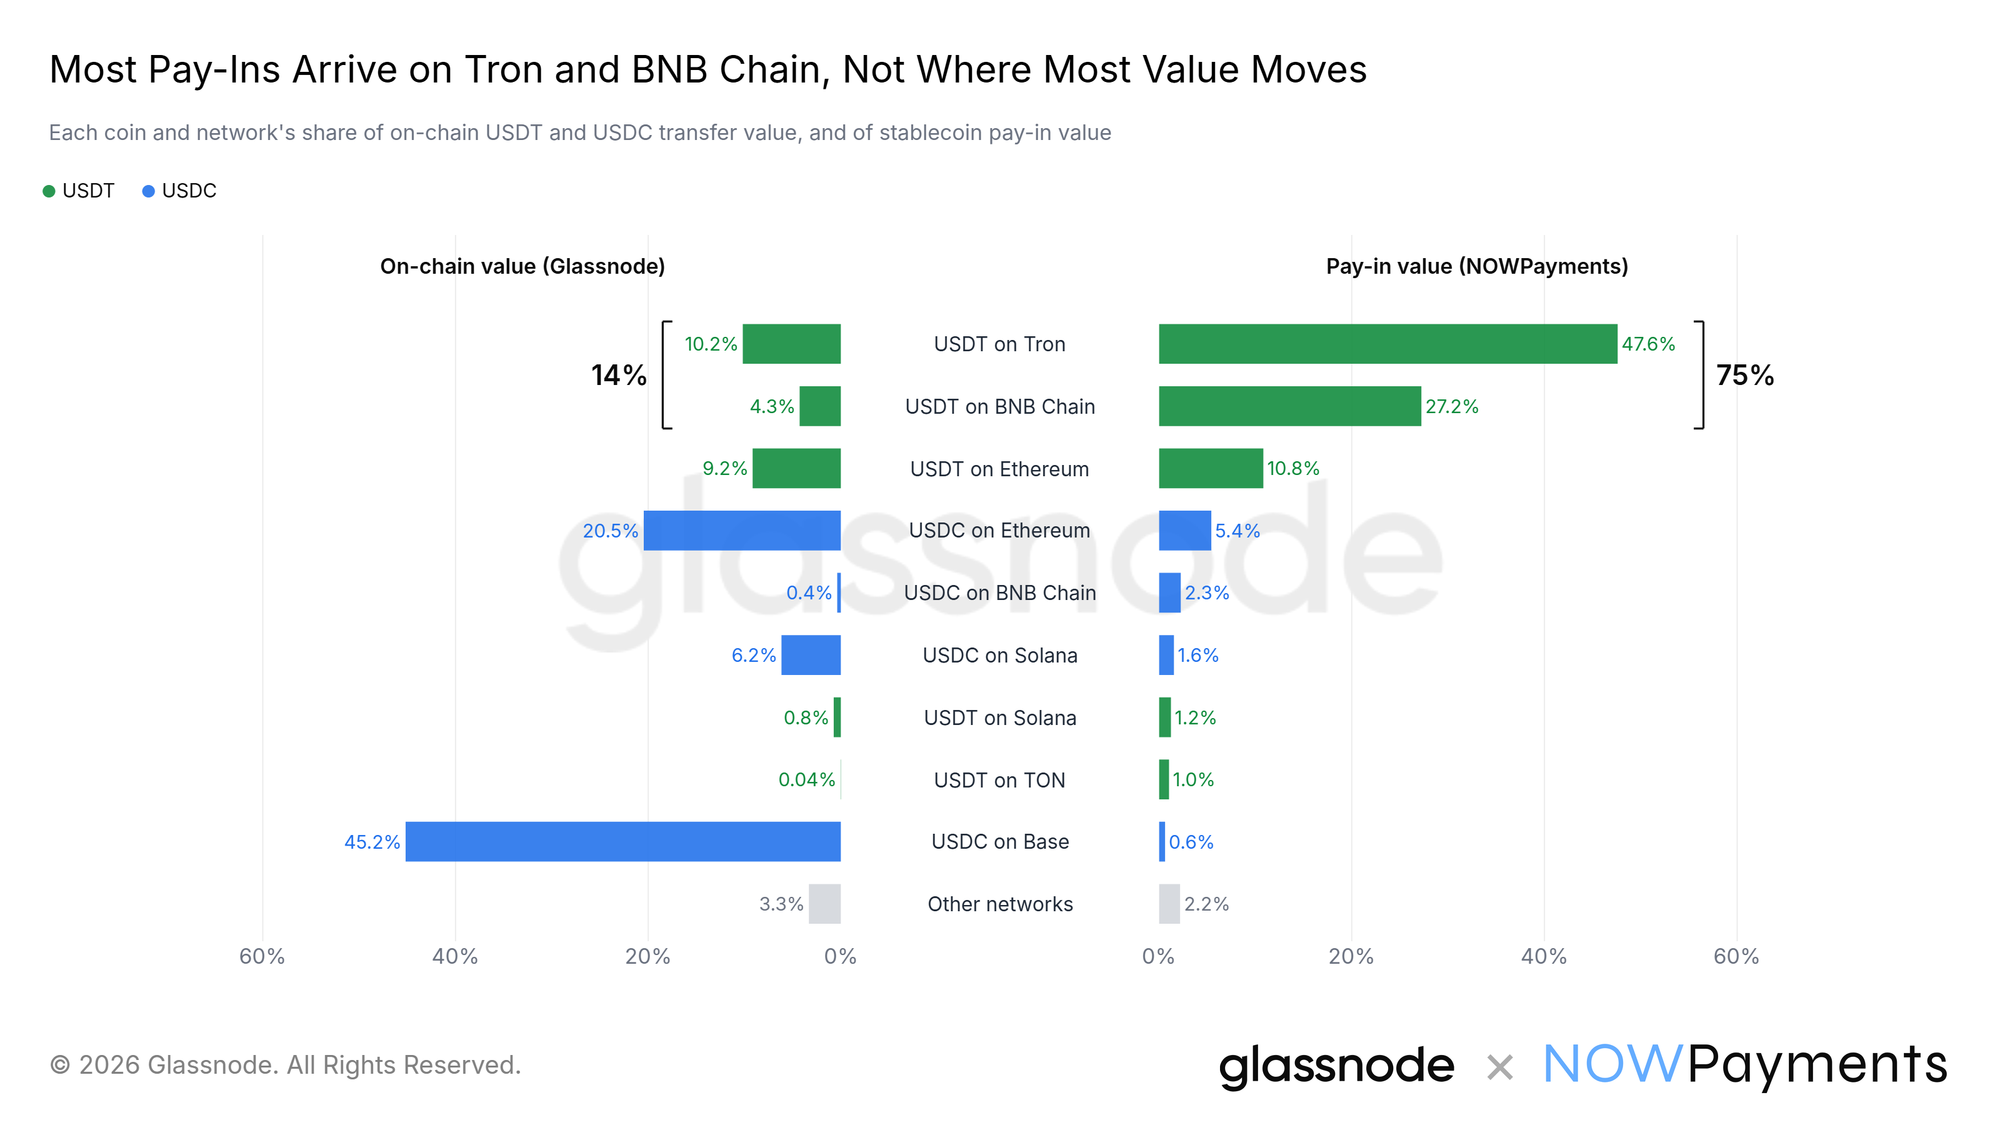
Over September 2025–September 2026, Base USDC was 45.2% of combined on-chain USDT and USDC transfer value, and 0.6% of NOWPayments merchant receipt value.
USDT on Tron and USDT on BNB Chain together were 14% of that on-chain transfer total and 75% of actual merchant receipt value. USDT on Tron, BNB Chain and Ethereum combined was 86% of stablecoin amounts received at the NOWPayments checkout.
The three largest on-chain transfer combinations in the summary — Base USDC, Ethereum USDC and Tron USDT — were 54% of real merchant receipts. Using the distribution of on-chain active addresses to infer which channels merchants were paid on fit about twice as well as using transfer value alone. That is a reported match between distributions, not evidence that an active address is a buyer.
The comparison supports a limited claim: in this gateway’s receipts, most commercial inflow sat on rails that were a small share of network transfer value. Rank by gross on-chain flow is not rank by these receipts.
Receipt counts peak on a later hour
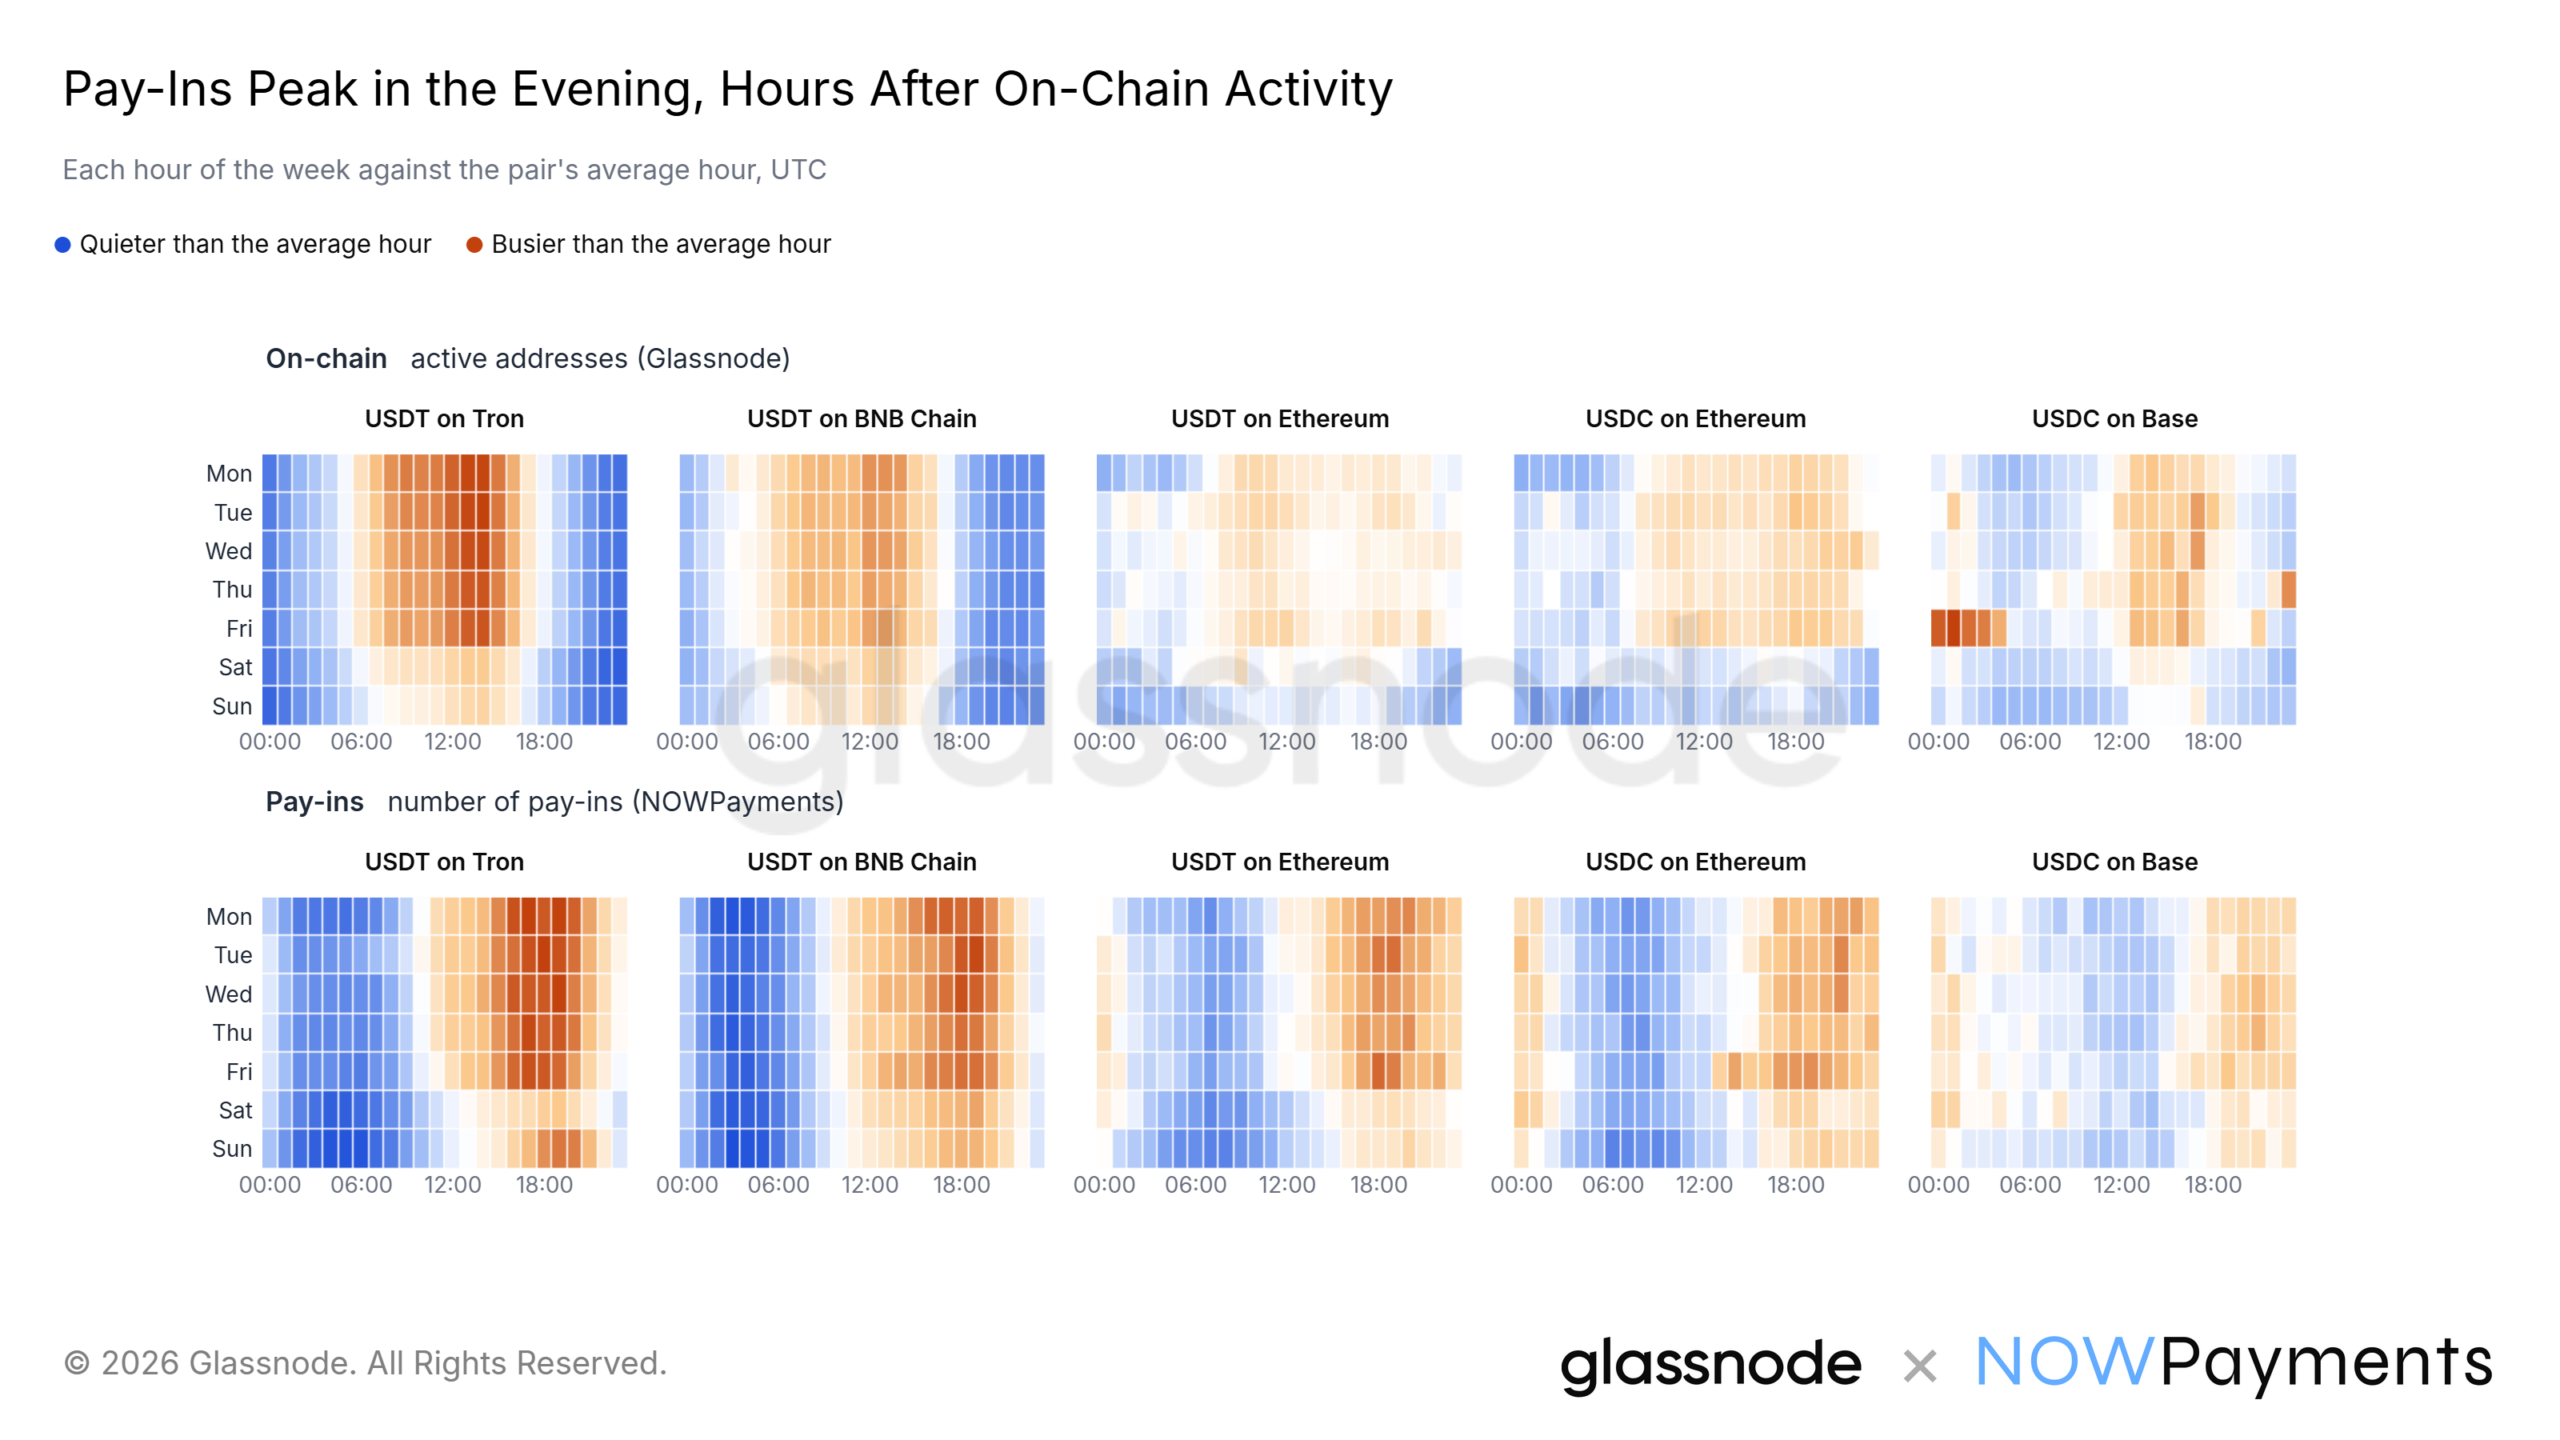
For the 39 complete weeks before 4 October 2026, merchant receipt counts on the major channels clustered at 19:00–21:00 UTC, which is 03:00–05:00 the next calendar day in Beijing time (UTC+8). The summary says this lagged the peak in network-wide on-chain active addresses by several hours. It does not name that earlier hour.
The hourly series is a count of receipts. The chain shares above are amounts. They are not interchangeable. The figure is described as five main stablecoin channels; the prose does not list those five series. It does say support and risk coverage would need to be rostered to the receipt peak rather than to the chain’s busiest address hours. That staffing note is attached to the timing gap; the article does not measure headcount.
Supply and daily ledger flow as of 5 October 2026
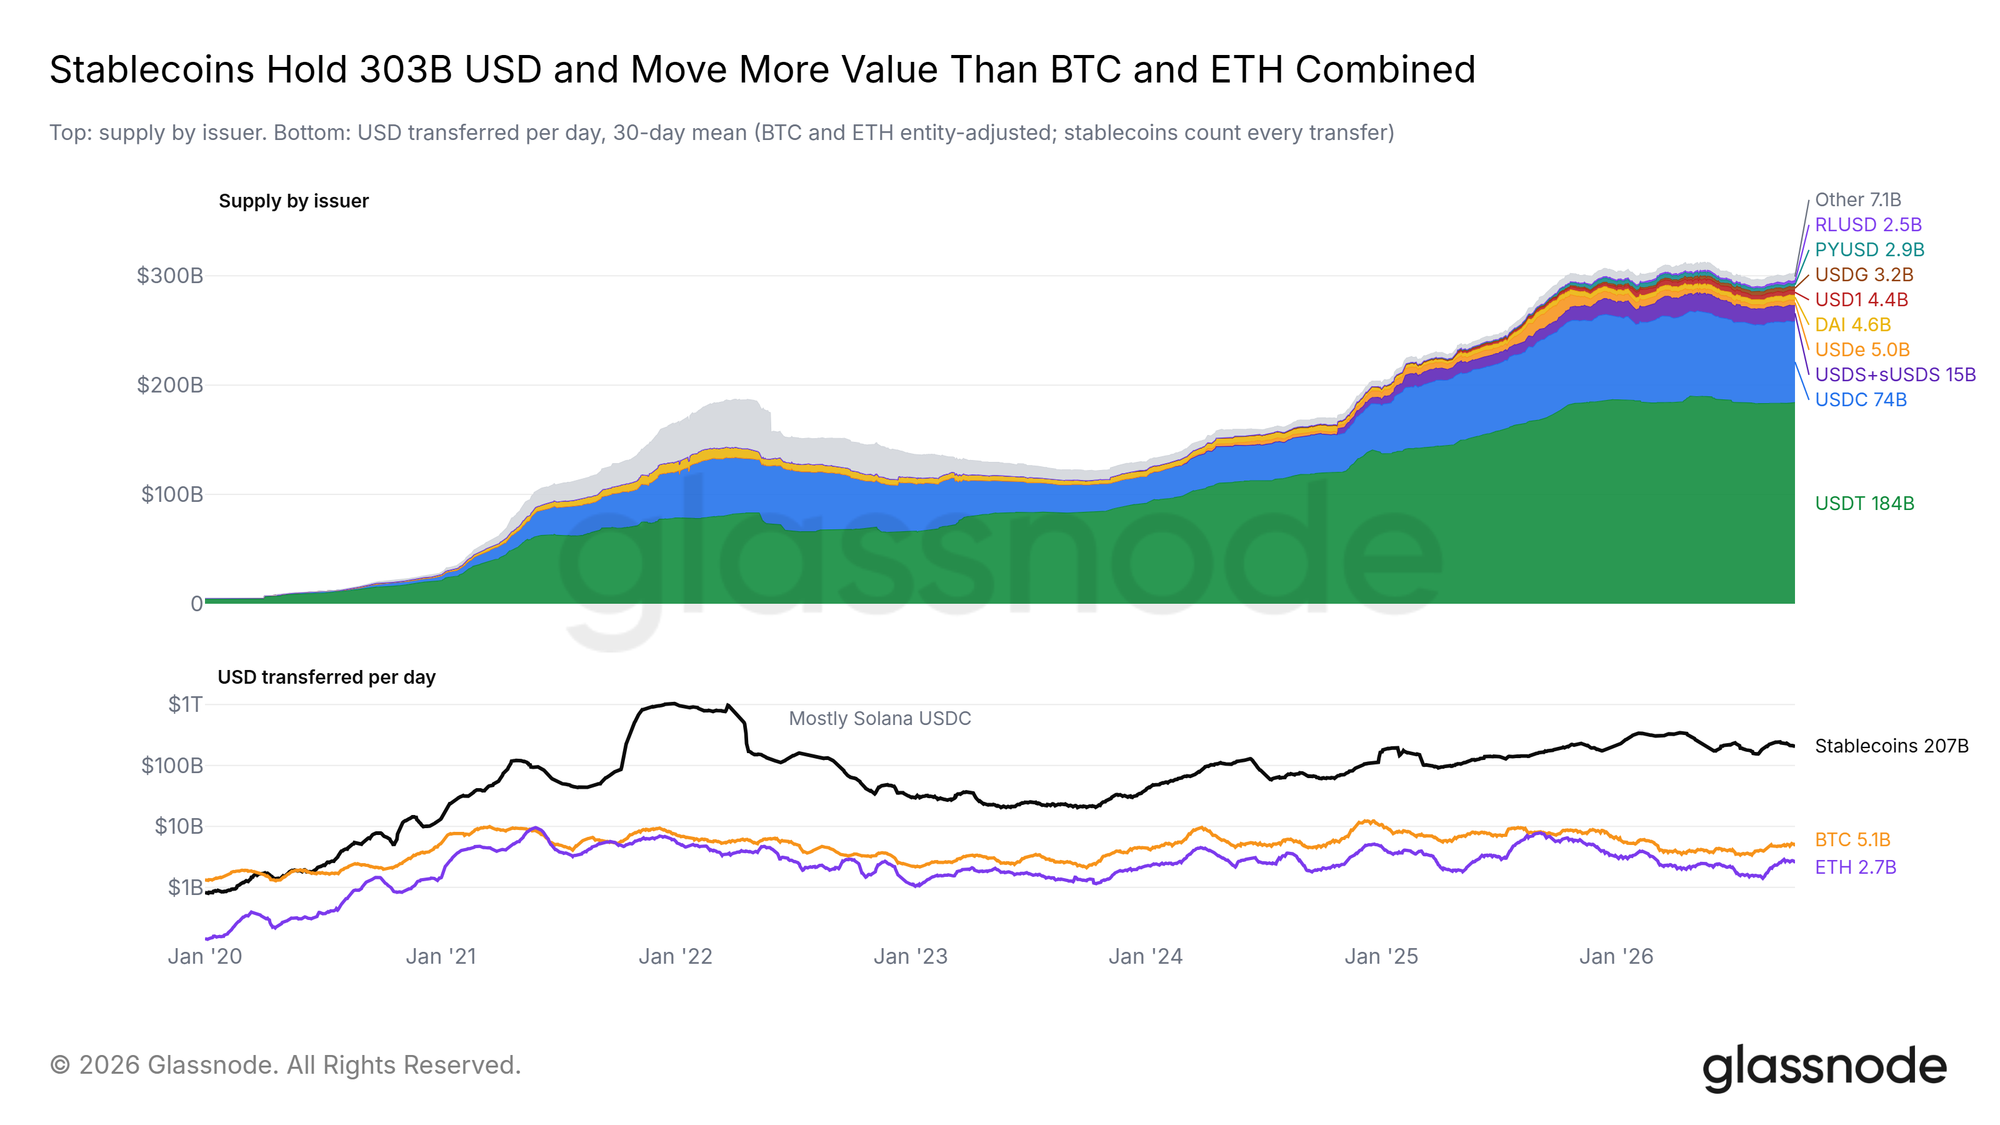
As of 5 October 2026, the summary puts total stablecoin supply at $303 billion, of which USDT was $184 billion and USDC was $74 billion. On a 30-day average, daily on-chain transfer value was $207 billion for stablecoins, $5.1 billion for Bitcoin and $2.7 billion for Ethereum. Stablecoin transfer value is described as larger than Bitcoin and Ethereum combined even when every Bitcoin on-chain transaction is included.
That is dollars moved on ledgers. It is not a count of commercial sales. The same summary’s main result is that transfer value and merchant receipts diverge.
What is only named, not quantified, here
TechFlow attributes the work to the first “Money in Motion” study from Glassnode and NOWPayments, titled “Stablecoins in Commerce.” Beyond the figures above, it says the PDF discusses supply by issuer, transfer-size and turnover differences between USDT and USDC, how many tokens and networks would cover most payment sources in the dataset, receipt mix for trading platforms, cross-border e-commerce, SaaS subscriptions and online entertainment, and steps for choosing a settlement network, staffing the peak and comparing explicit and implicit cost. Those breakdowns are not in the TechFlow text, so no shares, thresholds or fees are added here. The article says the PDF can be downloaded free; it does not give a separate file URL in the text used for this rewrite.
The verifiable result in the compilation is the mismatch between the stated on-chain USDT/USDC aggregates and NOWPayments receipts, plus the later count peak. It does not identify wallet owners, explain why payers used a given chain, or measure commerce outside that gateway.
Original article: TechFlow, published 11 November 2026, 09:55 UTC+8, compiling Glassnode and NOWPayments — https://www.techflowpost.com/zh-CN/article/35273.