
What the supply measure shows
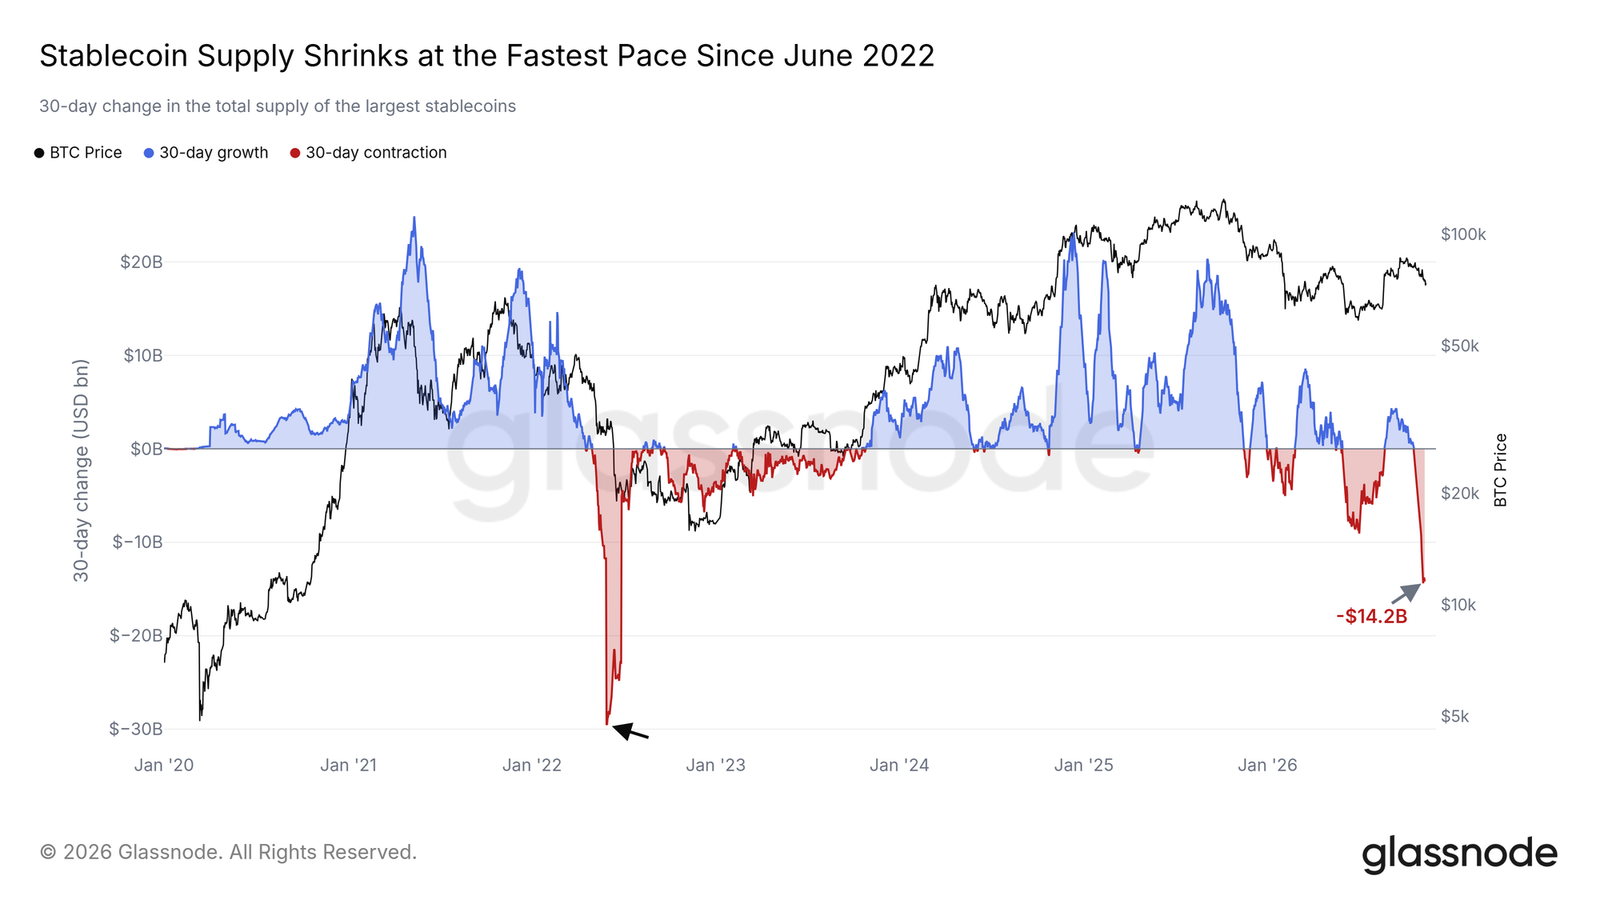
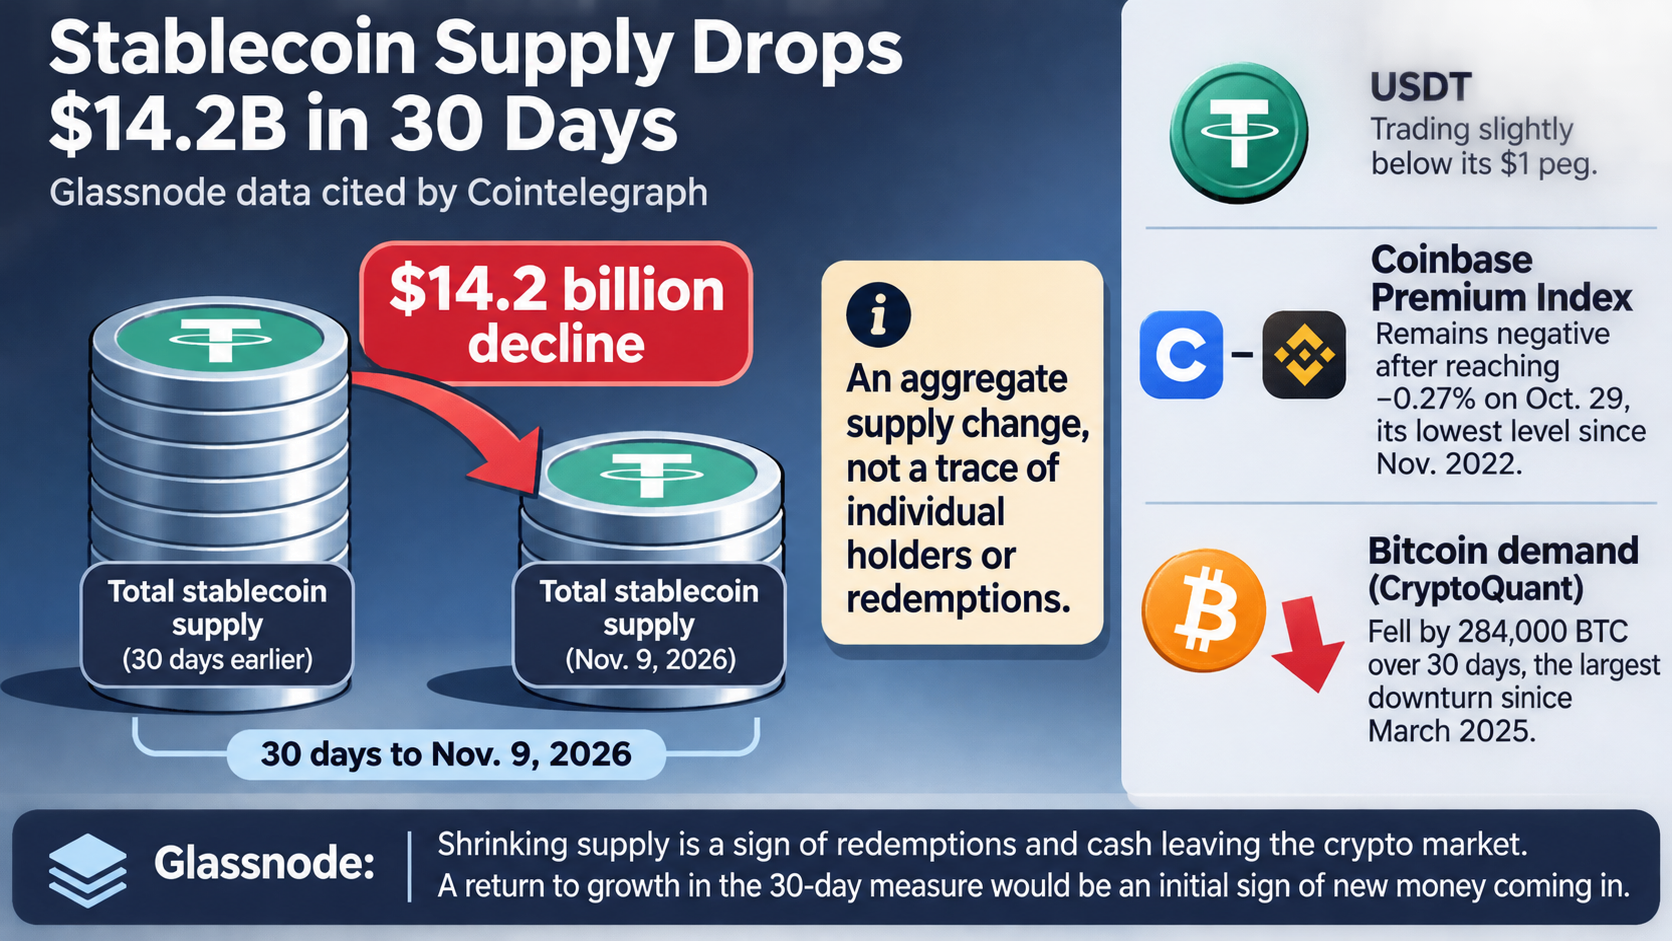
In reporting published on November 12, 2026, at 19:38 (UTC+8), Cointelegraph cited Glassnode data showing that total stablecoin supply fell by $14.2 billion over the 30 days to November 9. It was the largest 30-day decline since June 2022, when supply fell by nearly $30 billion. Glassnode’s measure also exceeded the $9.5 billion decline reported around July 1, when Bitcoin fell below $58,000.
The figure describes a change in aggregate supply over a defined window—not a record of which holders redeemed tokens or what they did with the proceeds. Glassnode interpreted shrinking supply as a sign of redemptions and cash leaving the crypto market. It said a return to growth in the 30-day measure would be an initial sign of new money coming in.
Other market measures
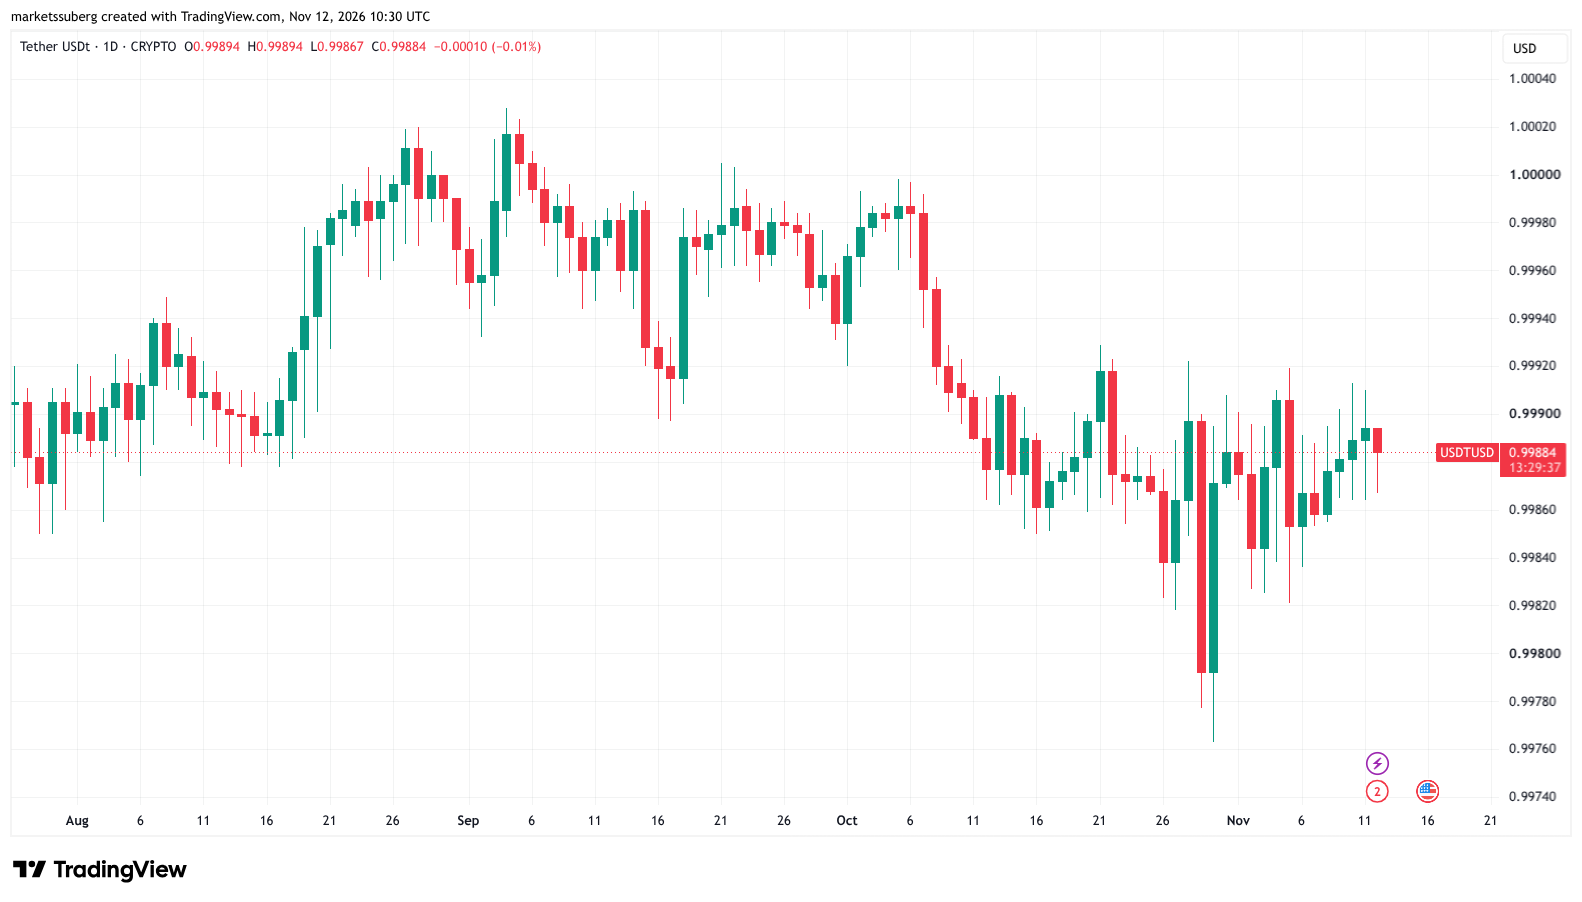
Cointelegraph reported that USDT was trading slightly below its $1 peg, citing TradingView data. Glassnode attributed that deviation to the same pressure it saw in investors moving out of stablecoins.
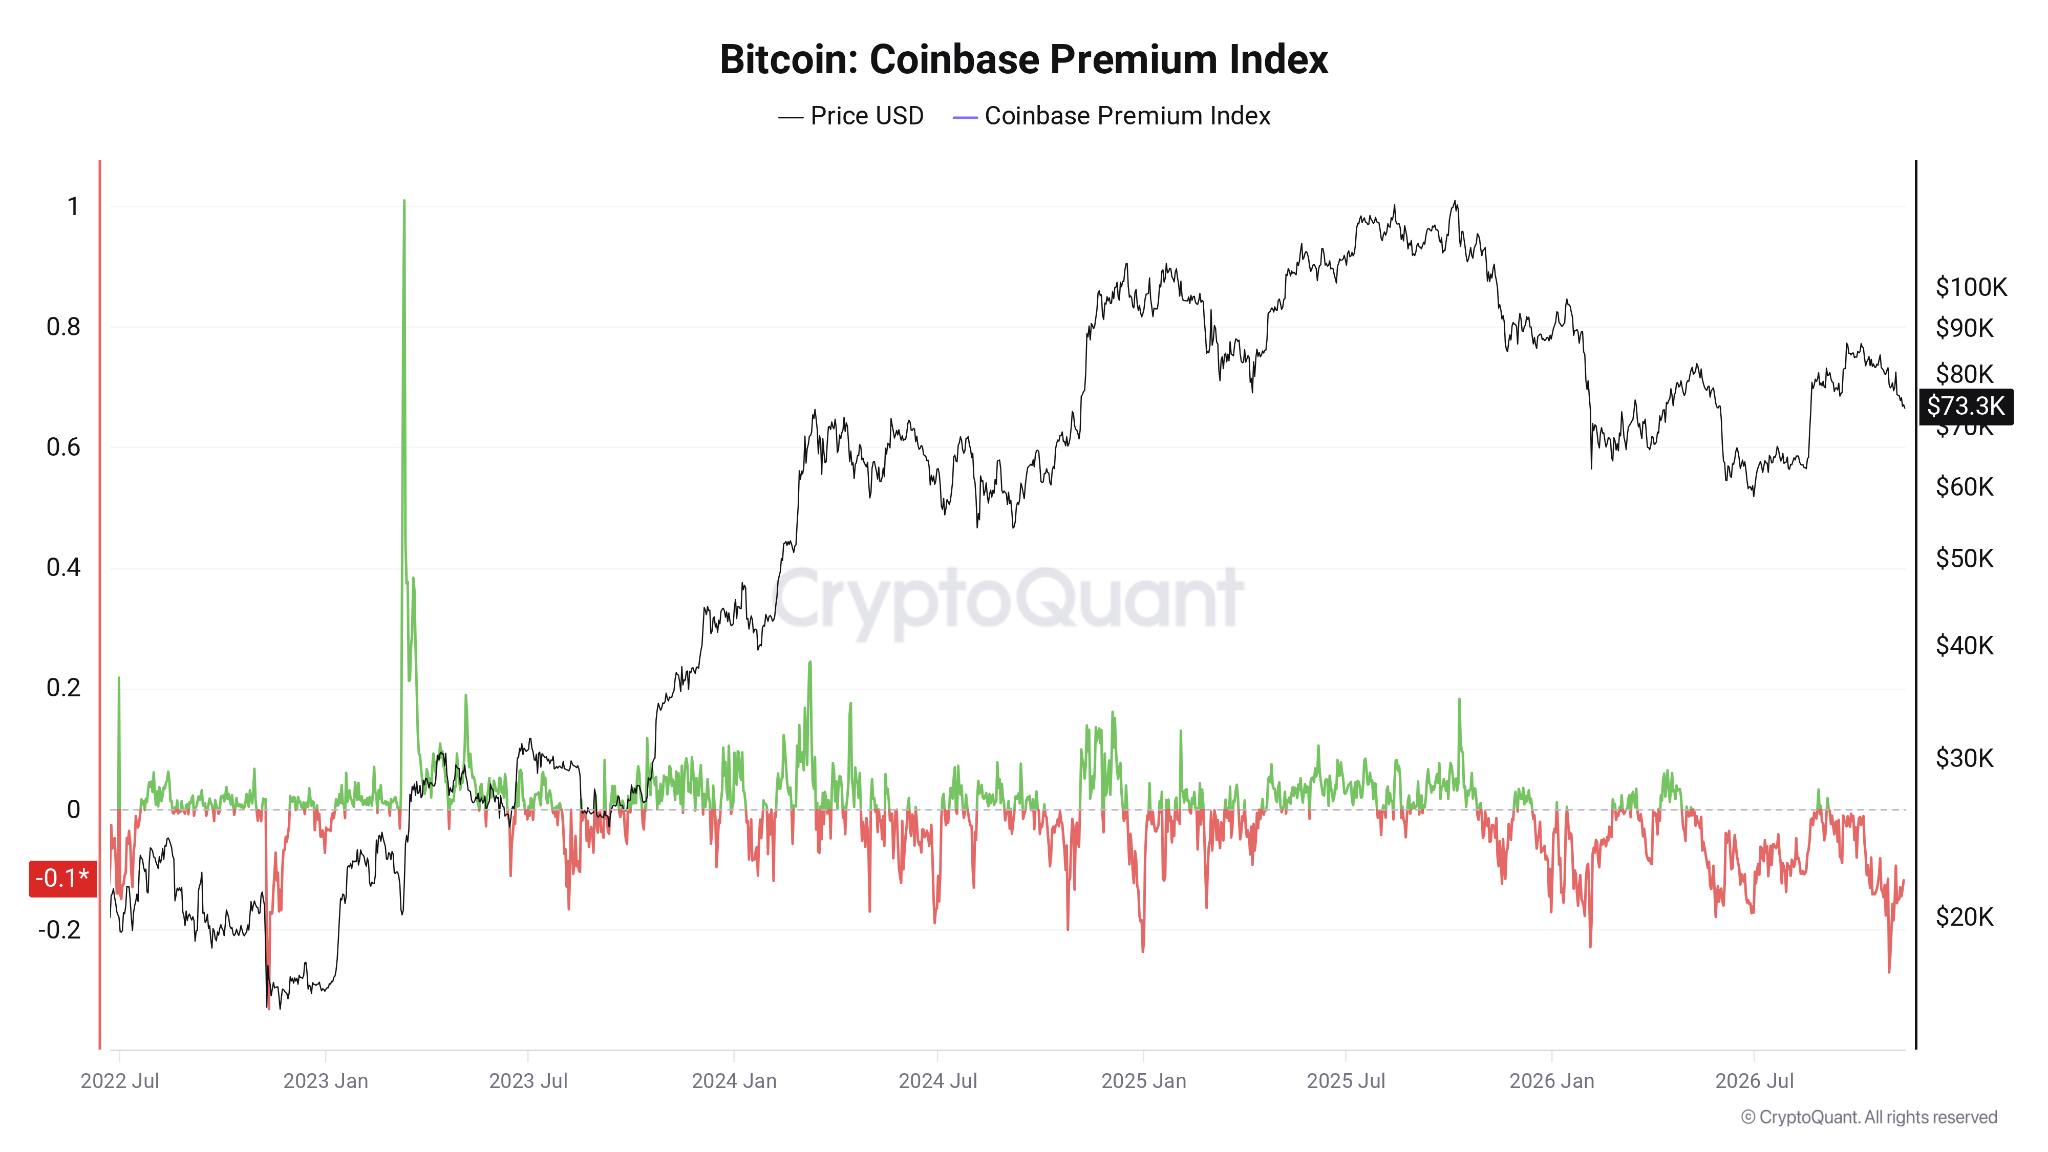
A separate measure, the Coinbase Premium Index, compares Coinbase’s BTC/USD price with Binance’s BTC/USDT price. It remained negative on Wednesday, November 11, after reaching −0.27% on October 29, its lowest level since November 2022. CryptoQuant contributing analyst Amr Taha said the discount suggested weaker relative demand or greater selling pressure on Coinbase; the index alone does not establish the cause.
CryptoQuant also reported that its measure of Bitcoin demand fell by 284,000 BTC over 30 days, the largest downturn in that measure since March 2025.
Source: cointelegraph.com (originally published 2026-11-12 19:38 UTC+8)